
Illustrations via Nehal Joshi
Every year, NBA All-Star Weekend concludes on Sunday with the league’s signature exhibition event, the All-Star Game. But for most basketball fans, All-Star Saturday Night is what they look forward to most. From the Three-Point Contest to the Slam Dunk Contest, it’s a showcase of the best the league has to offer in terms of individual talent that brings up-and-coming stars together with legends like Yao Ming and Charles Barkley, who provide judgment and commentary throughout. And whether you’re a diehard NBA fan, an avid college hoops enthusiast, or someone who hardly pays any attention to basketball, you can’t help but have fun watching.
In the weeks leading up to the weekend, many outlets devote their editorial resources to predicting the winners of its various events and discussing the merits of players who were snubbed and invitees who probably should have stayed home. But instead of exploring why the league chose to overlook Russell Westbrook as an All-Star starter in the West, or why Barack Obama wasn’t asked to compete in the Celebrity Game, we set out to answer a question literally nobody was asking: who would reign supreme in a battle between the most prolific shooters in Three-Point Contest history and the highest flyers ever to compete in the Slam Dunk Contest.
Here’s how we attempted to tackle this complicated (and admittedly kind of genius) hypothetical…
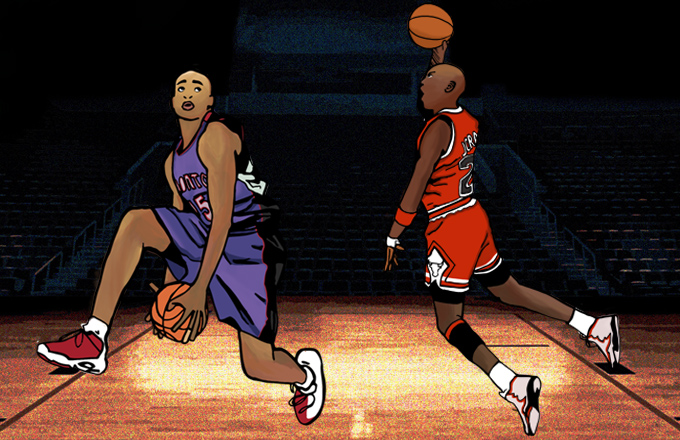
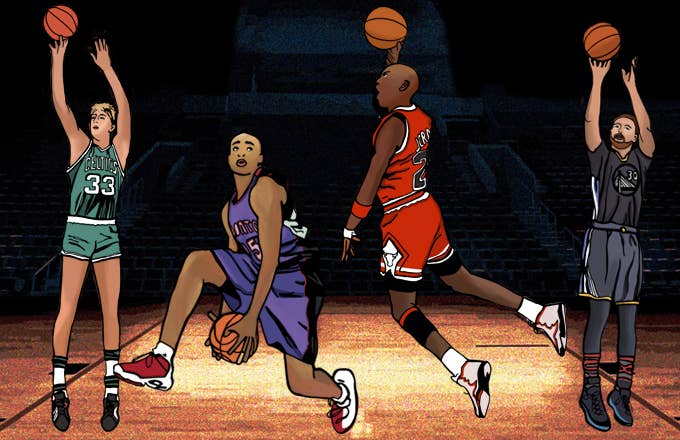
We decided to select five-man units for each team constructed only of past winners from the two contests, which became staples of All-Star Weekend in the mid-'80s. Each squad would be comprised of a point guard, two wing players, and two big men. From there, we would use whatifsports.com's NBA simulator to predict the outcome of a best-of-seven series between the two teams, assuming each player was at the age and level of production they were when they won their respective contests.
With three decades of Three-Point Contest and Dunk Contest winners to choose from, narrowing that list down to just five on each side proved difficult. Some choices were easy, like putting 1987-88 Michael Jordan on the Dunkers or 2005-06 Dirk Nowitzki on the Shooters. And because of the necessity of creating as cohesive a five-man unit as possible for each team, there were some notable snubs, including Dominique Wilkins, Jason Richardson, and Kobe Bryant for the Dunkers and Glen Rice, Peja Stojaković, and Kyrie Irving for the Shooters. In the end, we selected the following players:
Dunkers
PG: John Wall (2013-14)
SG: Michael Jordan (1986-87)
SF: Vince Carter (1999-00)
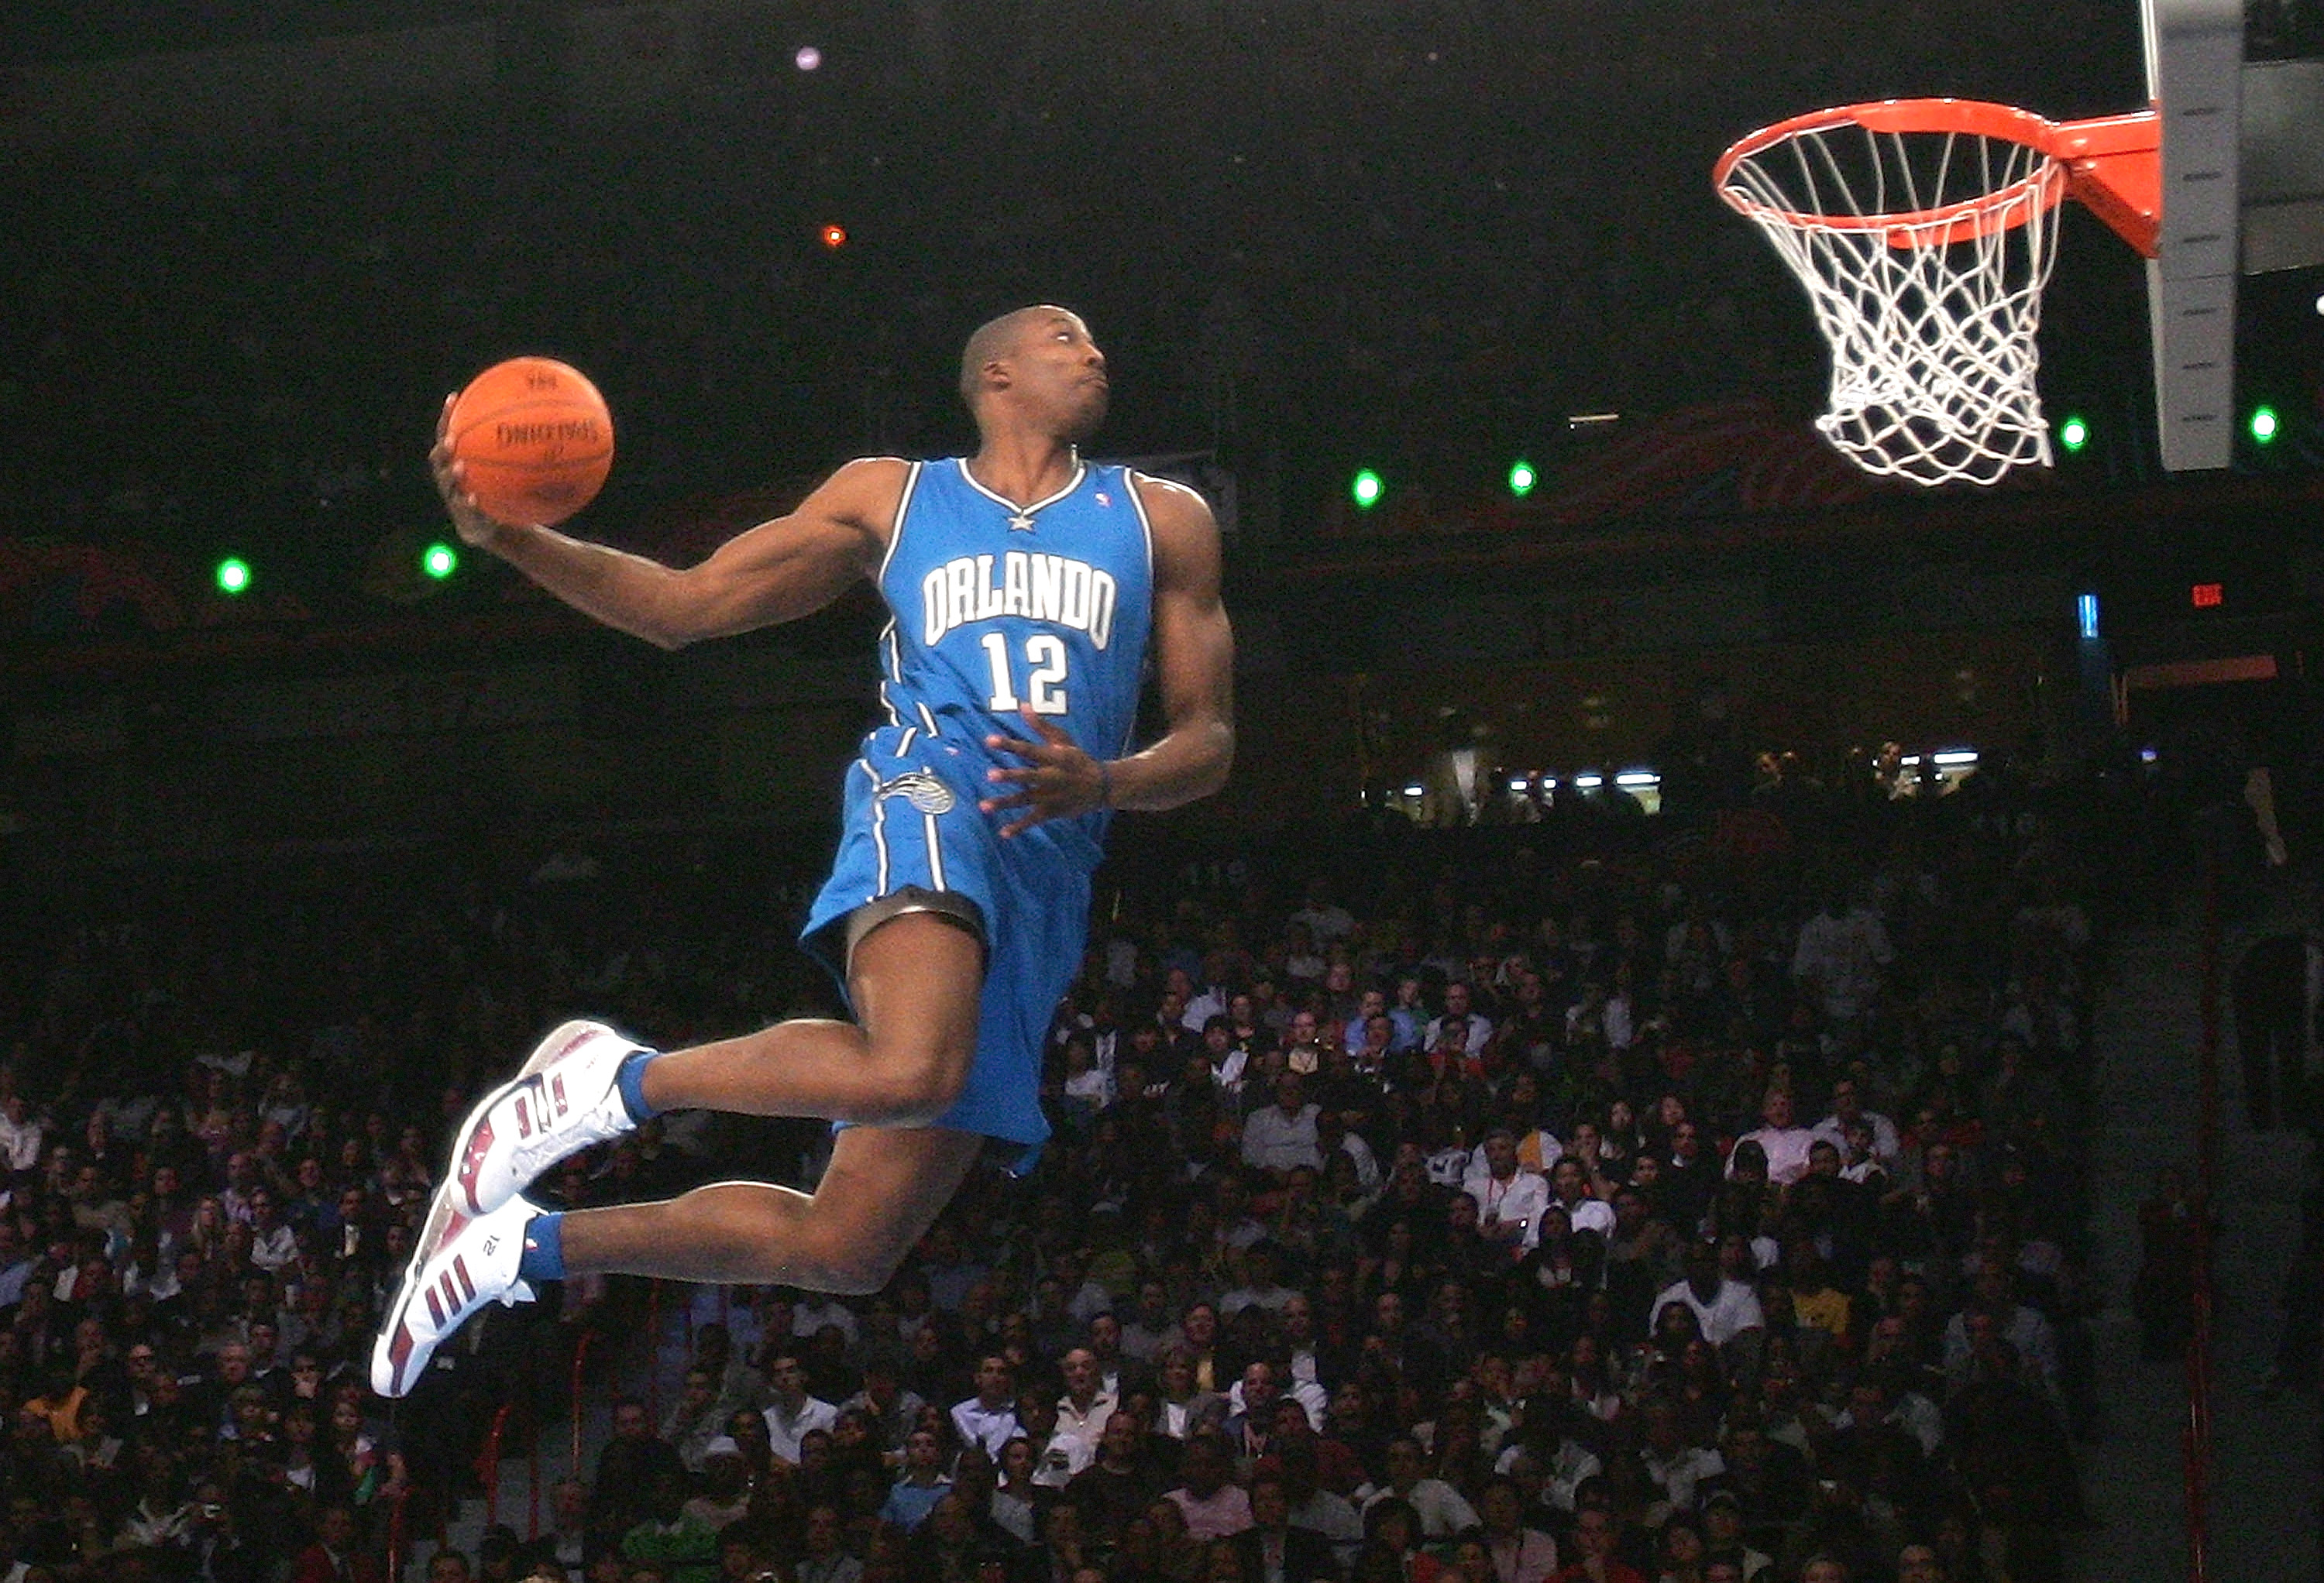
PF: Blake Griffin (2010-11)
C: Dwight Howard (2007-08)
Shooters
PG: Steph Curry (2014-15)
SG: Ray Allen (2000-01)
SF: Paul Pierce (2009-10)
PF: Larry Bird (1986-87)
C: Dirk Nowitzki (2005-06)
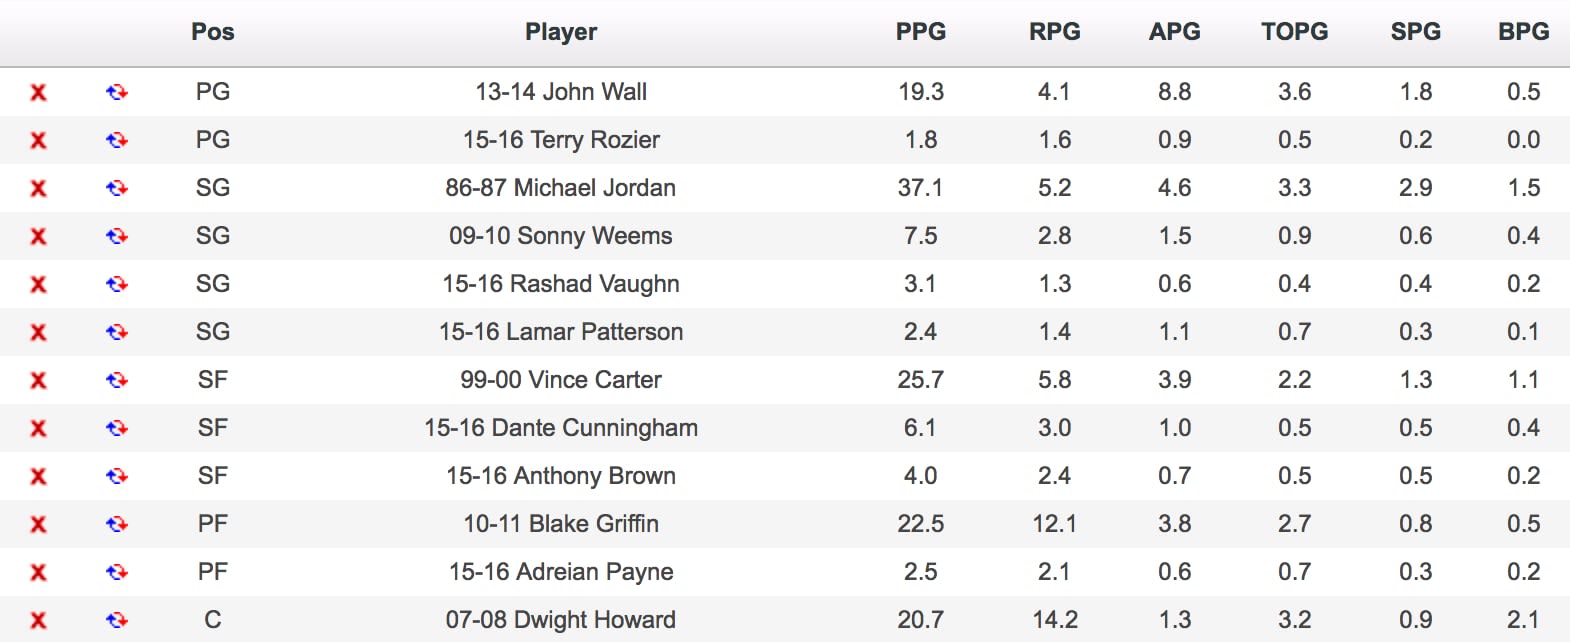
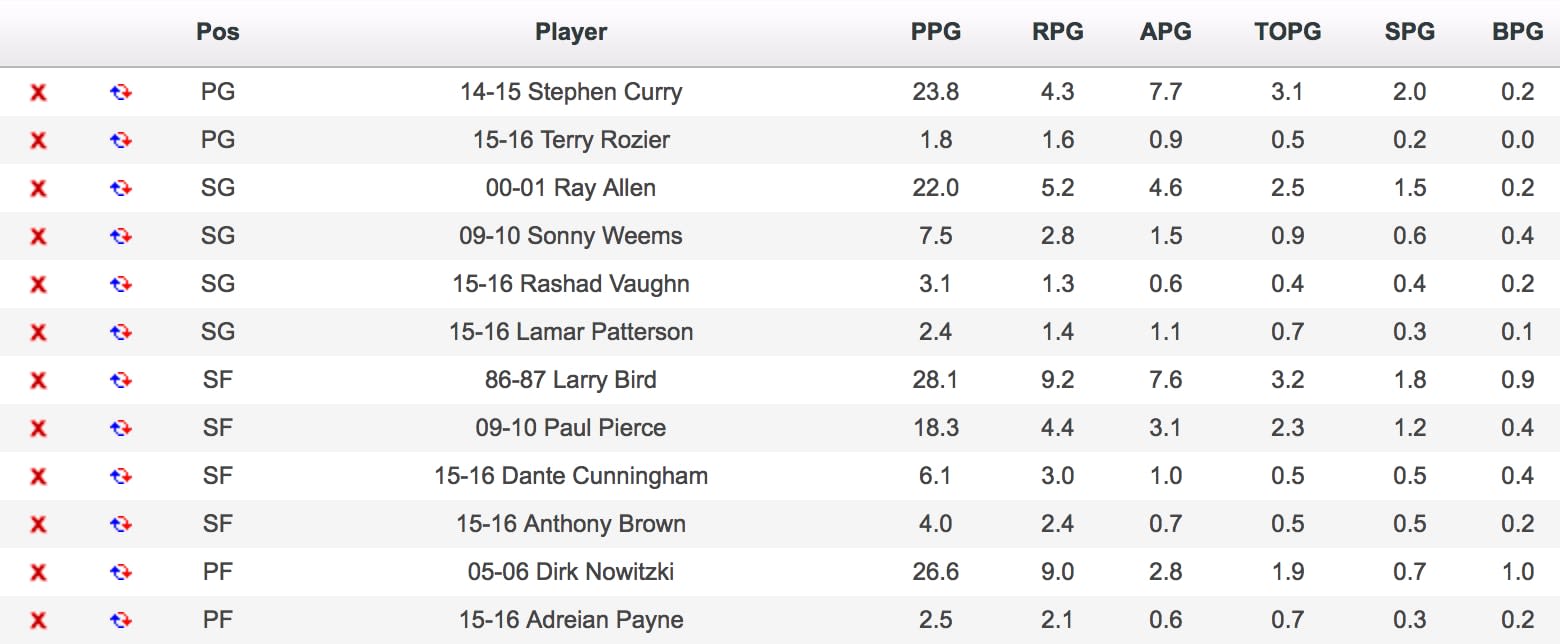
Because of the potential for injuries, foul trouble, and other variables in whatifsports.com's projection model, we filled out each of the two rosters with an identical set of reserves—the five players from last season with the lowest player efficiency rating. That group was comprised of Terry Rozier, Sonny Weems, Rashad Vaughn, Lamar Patterson, and Adreian Payne.
We decided a best-of-seven series would be most appropriate for this experiment, with games alternating between the two teams’ home arenas, the Air Canada Centre for the Dunkers and Oracle Arena for the Shooters. A coin was flipped to determine home-court advantage, with the Shooters winning that right. Each simulated game was 48 minutes long, with normal overtime procedure, foul limits, etc. The five starters from each team were set to play every minute of every game. However, foul outs, injuries, ejections, and other variables accounted for several minutes of reserve play each game.
The Prediction
Because of the stark contrast between the two teams, we expected one of them to emerge pretty quickly as the superior squad. But while the Dunkers were able to notch a 4-3 series victory, the Shooters were hardly slouches themselves. Here’s how the series shook out:
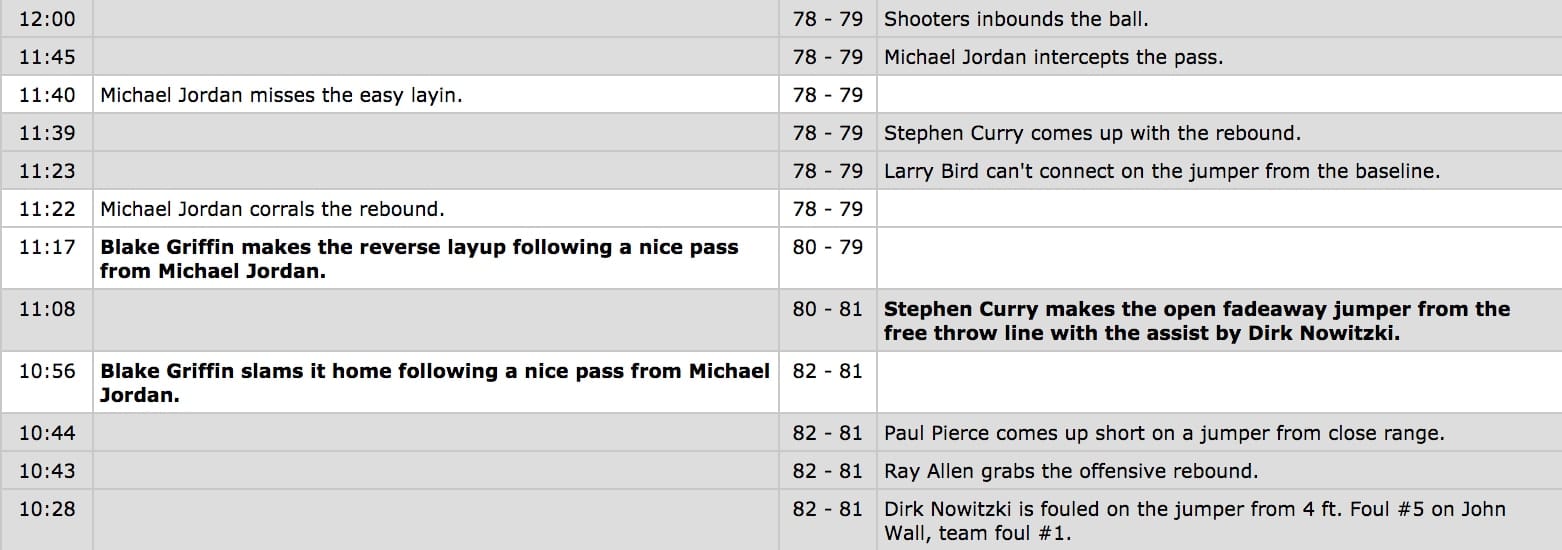
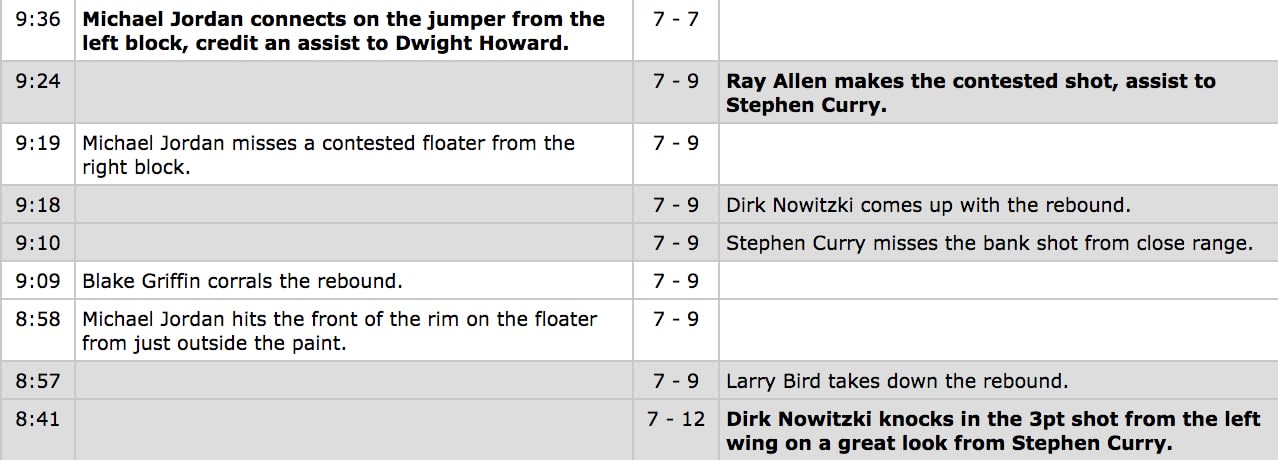
Game 1: Dunkers 107, Shooters 105 (1-0 Dunkers Lead)
Game 2: Shooters 89, Dunkers 103 (2-0 Dunkers Lead)
Game 3: Dunkers 95, Shooters 100 (2-1 Dunkers Lead)
Game 4: Shooters 96, Dunkers 121 (3-1 Dunkers Lead)
Game 5: Dunkers 108, Shooters 112 (3-2 Dunkers Lead)
Game 6: Shooters 129, Dunkers 110 (3-3 Series Tied)
Game 7: Dunkers 108, Shooters 96 (4-3 Dunkers Win Series)
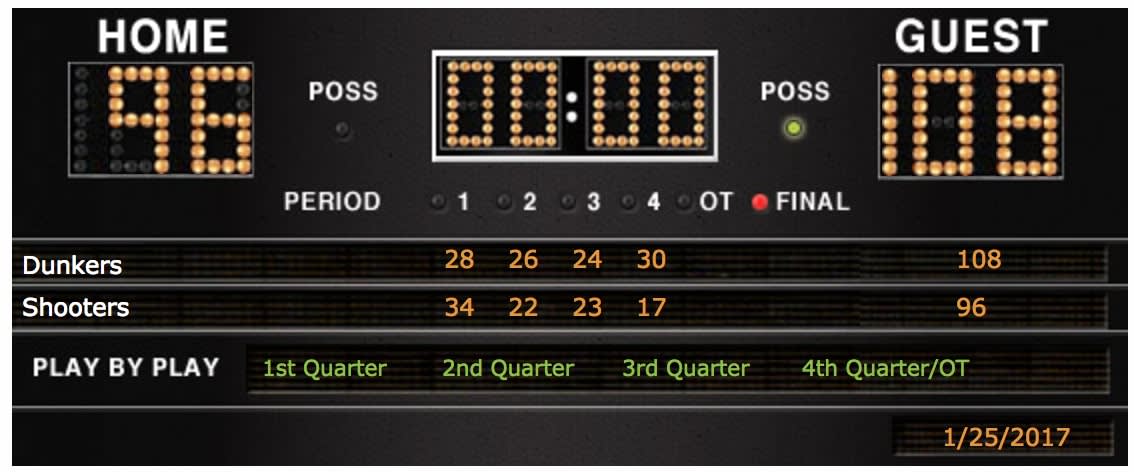
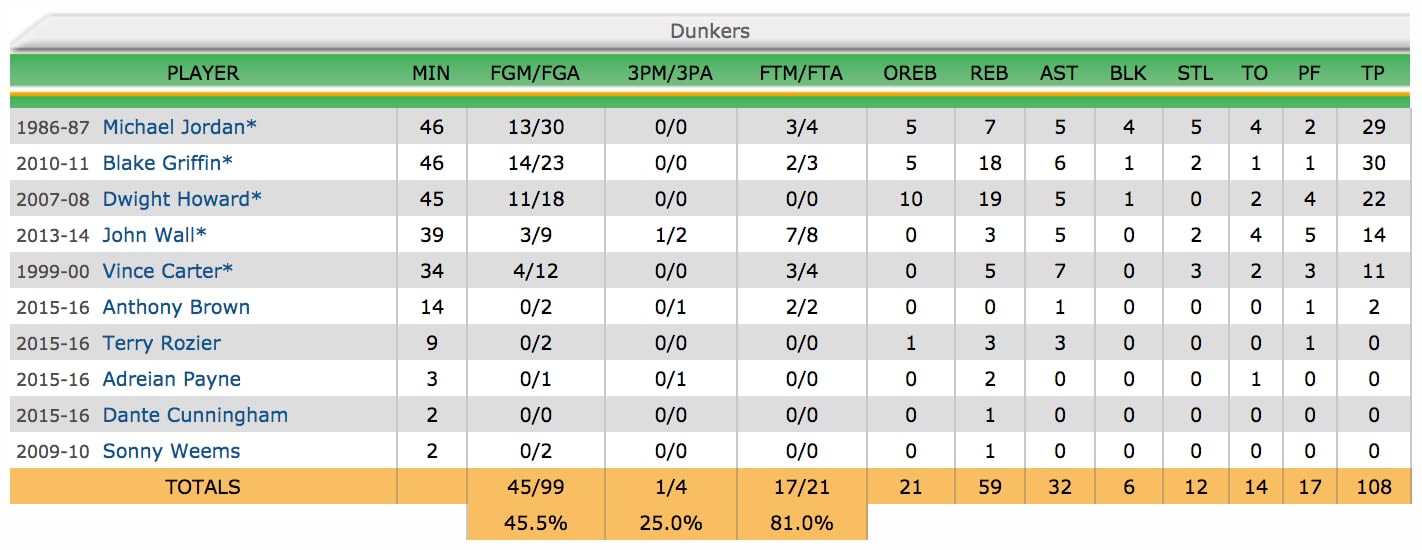
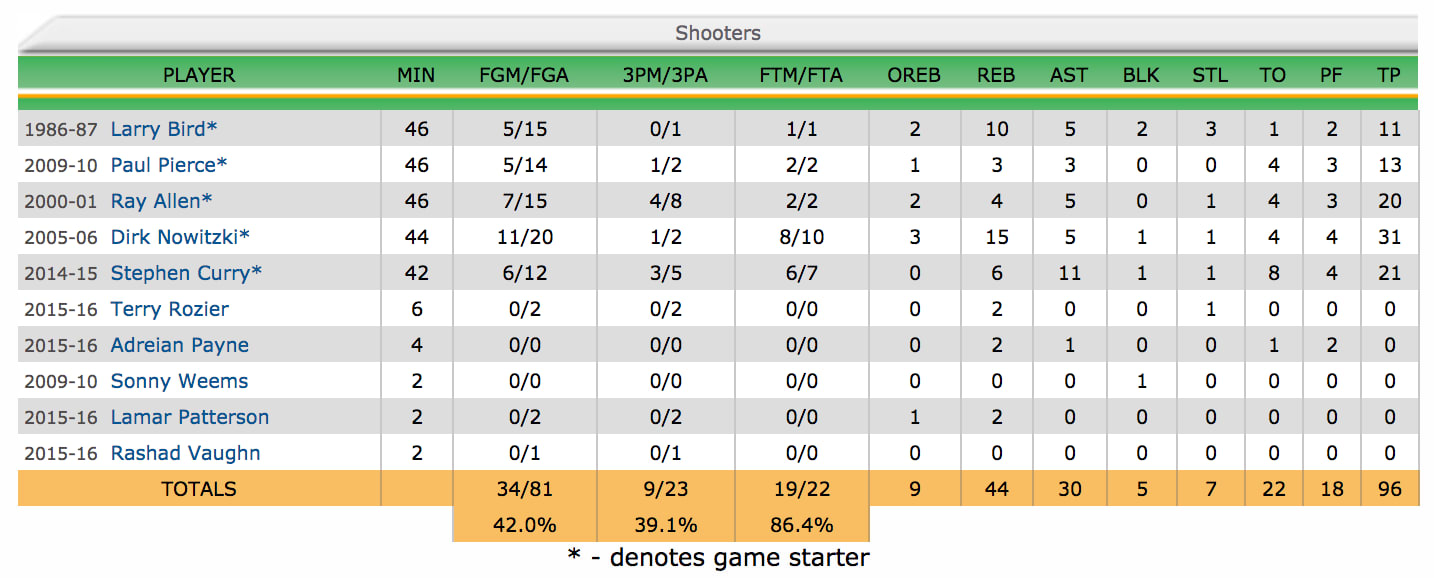
In the end, the Dunkers finished with an average of just 3.5 more net points per game than the Shooters, who fought back from a 3-1 series deficit to nearly give Steph Curry vindication for last year’s NBA Finals. Looking more closely at the box scores for each game, it was clear that the Dunkers were simply too physically imposing for the Shooters to handle. The Shooters were outrebounded by an average of nearly 10 boards per game, with their frontcourt of Larry Bird and Dirk Nowitzki standing absolutely no chance against Blake Griffin and Dwight Howard.
The Dunkers’ starting frontcourt combined to average a ridiculous 43.6 points and 33.9 rebounds per game and were also able to hold Bird and Nowitzki in check defensively. The two sharpshooting big men averaged 39.1 points per game,15.6 lower than their combined season averages in 1986-87 and 2005-06, respectively; remember, each played nearly 48 minutes per game in this series.
One would have imagined that Michael Jordan would have dominated in this series. After all, he scored a career-high 37.1 points per game in 1986-87, and he was being defended by Ray Allen, who was a particularly meh defender early in his career. But MJ was held to 25.0 points per game, partially as a result of Griffin and Howard taking such bloated roles in the Dunkers’ offense. Defensively, though, Jordan was a monster, averaging 3.1 steals per game and forcing Allen to commit as many turnovers as he did himself despite the fact that the sharpshooter averaged about half as many attempted shots.
Steph Curry, arguably the Shooters’ most dynamic player, was largely held in check by a combination of John Wall’s defense and his teammates’ obvious redundancies. Curry averaged 23.6 points and 8.6 assists per game—numbers that fall close to his season averages in 2014-15, but his efficiency took a substantial hit, and it took him more than 10 extra minutes per game to reach those figures. Wall, on the other hand, was better able to alter his game to fit his teammates’ style of play, taking on the role of quarterback in the Dunkers’ offense. His 11.6 assists per game to just 2.9 turnovers was a huge factor in the team’s success. Paul Pierce and Vince Carter largely went unnoticed throughout the series, overshadowed by the other players with whom they shared the court.
Unsurprisingly, 3-point shooting made up the largest statistical disparity between the two teams. The Dunkers attempted just 53 threes through seven games, converting at a 34.0% clip. The Shooters, on the other hand, took 156 shots from long range and made 44.2% of them.
The Conclusion